Timeline Lens
Use the timeline lens to find patterns in behaviour, keep up to date with changes and monitor activity. Results with relevant dates are plotted on a graph so you can see when things happen.
The items plotted on your graph are listed below and grouped by date. As you change your date type or range the list also updates.
Accessing the Timeline Lens
After performing a search, if any of your results have dates that can be used, the timeline lens will be available.
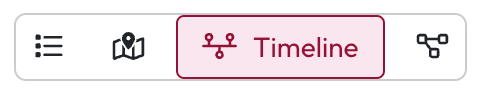
Select Timeline from the lenses menu.
Using the Timeline Lens
Date Type
Depending on the date type you select the graph can show you many things. When changes are made to a document, patterns in when results are created or documents that have not been modified for a long time.
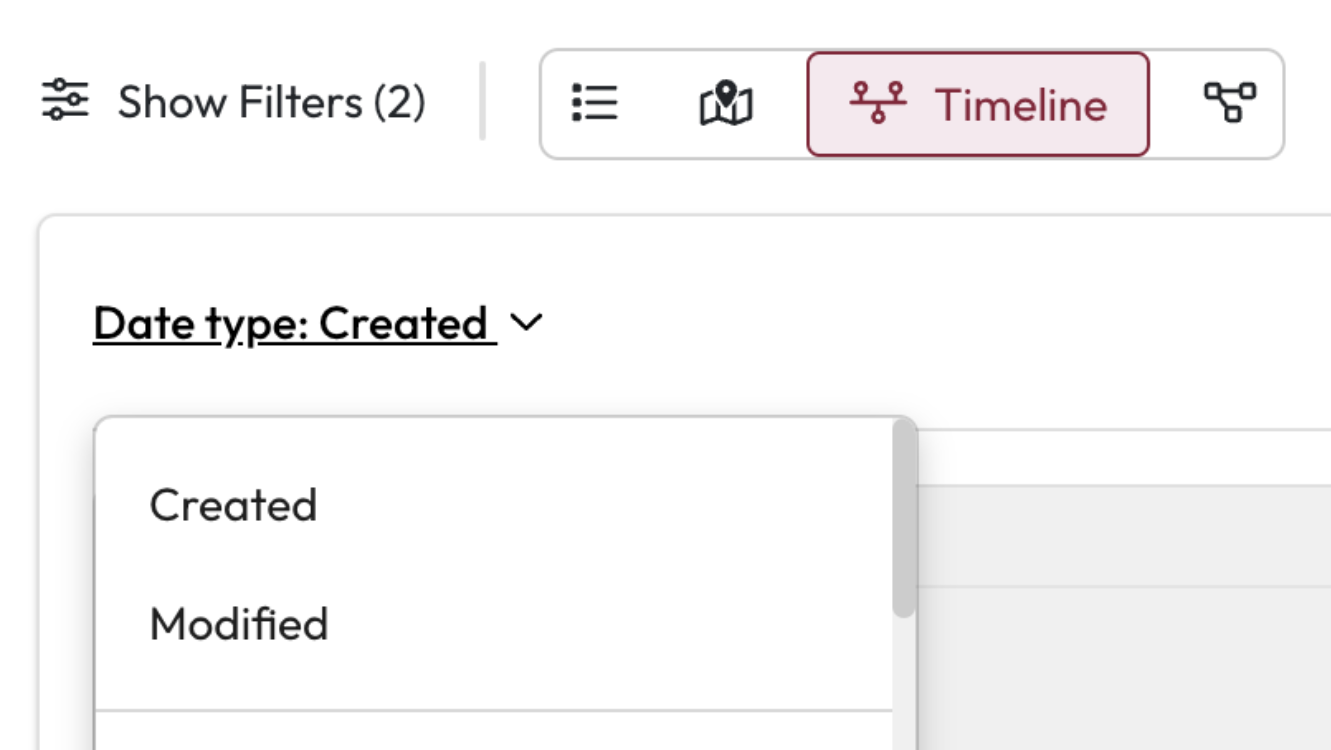
Date type: Select the dropdown to see all your available options.
Select the date type you want to explore from the dropdown list.
The page reloads when you change the date type.
Date Range
You can focus the results you are looking at based on a date range. This can help if you are interested in changes over the past 6 months or if you only want to look at items over 6 years old.
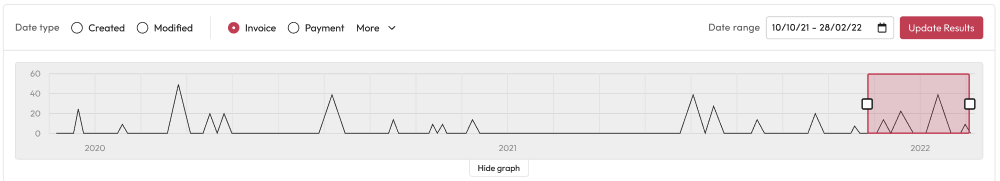
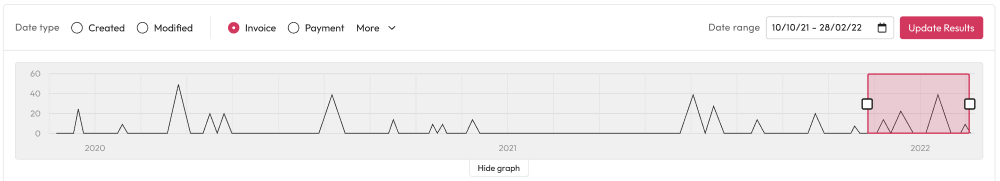
Date Range: Select Date Range above the graph to open the date selector.
Select the to and from date you want to use.
Select Update Results.
This focuses your results to this timeframe and will show a more detailed timeline.
Or
Use the highlighted area on the graph to expand and move your date range.
Select Update Results.
This focuses your results to this timeframe and will show a more detailed timeline.