Timeline Lens Activity Chart
This chart shows a timeline of documents and data items and how they were created or modified over time.
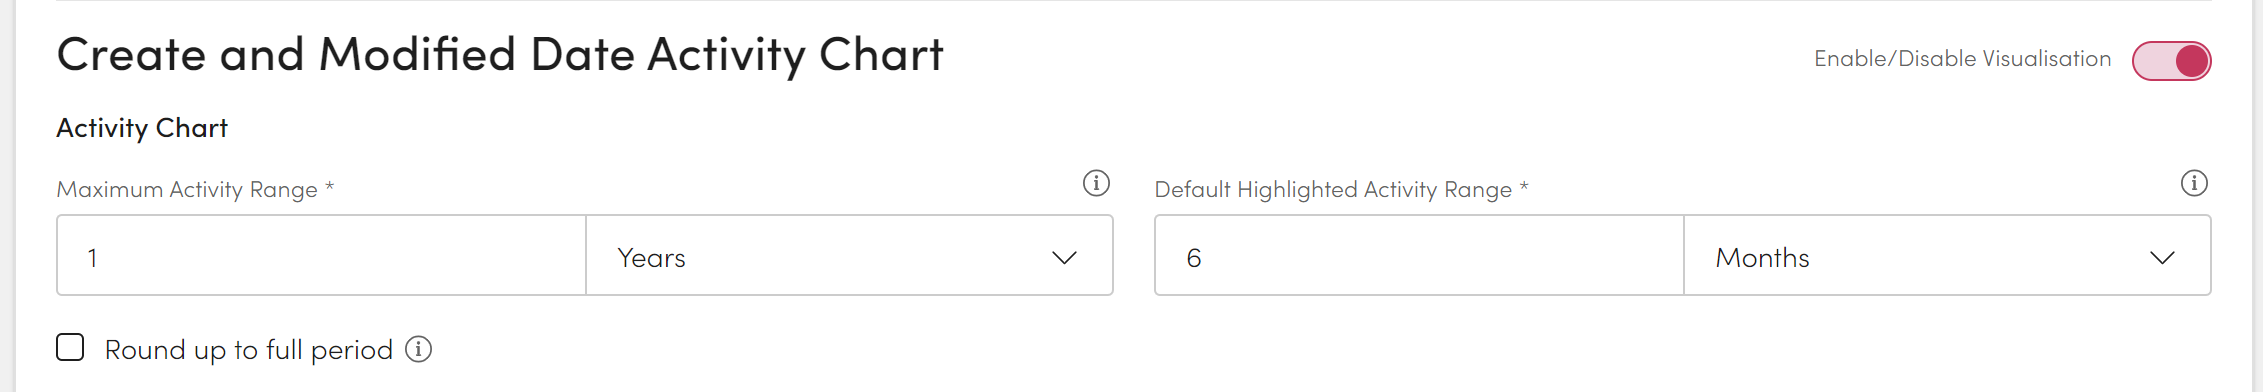
Check Enable/Disable visualisation to determine if users can use this visualisation.
Chose the Maximum Activity Range to determine the earliest date that can be selected on the chart.
Enter a number then select Days, Weeks, Months or Years from the Dropdown.
Chose the Default Highlighted Activity Range to determine the pre-filtered time of the chart.
Enter a number then select Days, Weeks, Months or Years from the Dropdown.
Check Round up to full period to auto expand a date range to cover a full day, week, month or year depending on your selection above.