Data Views
This graph allows you to visualise the items available in Workplace AI. It shows information about crawled, processed and enriched items. You can choose to view your data in a way that works for you.
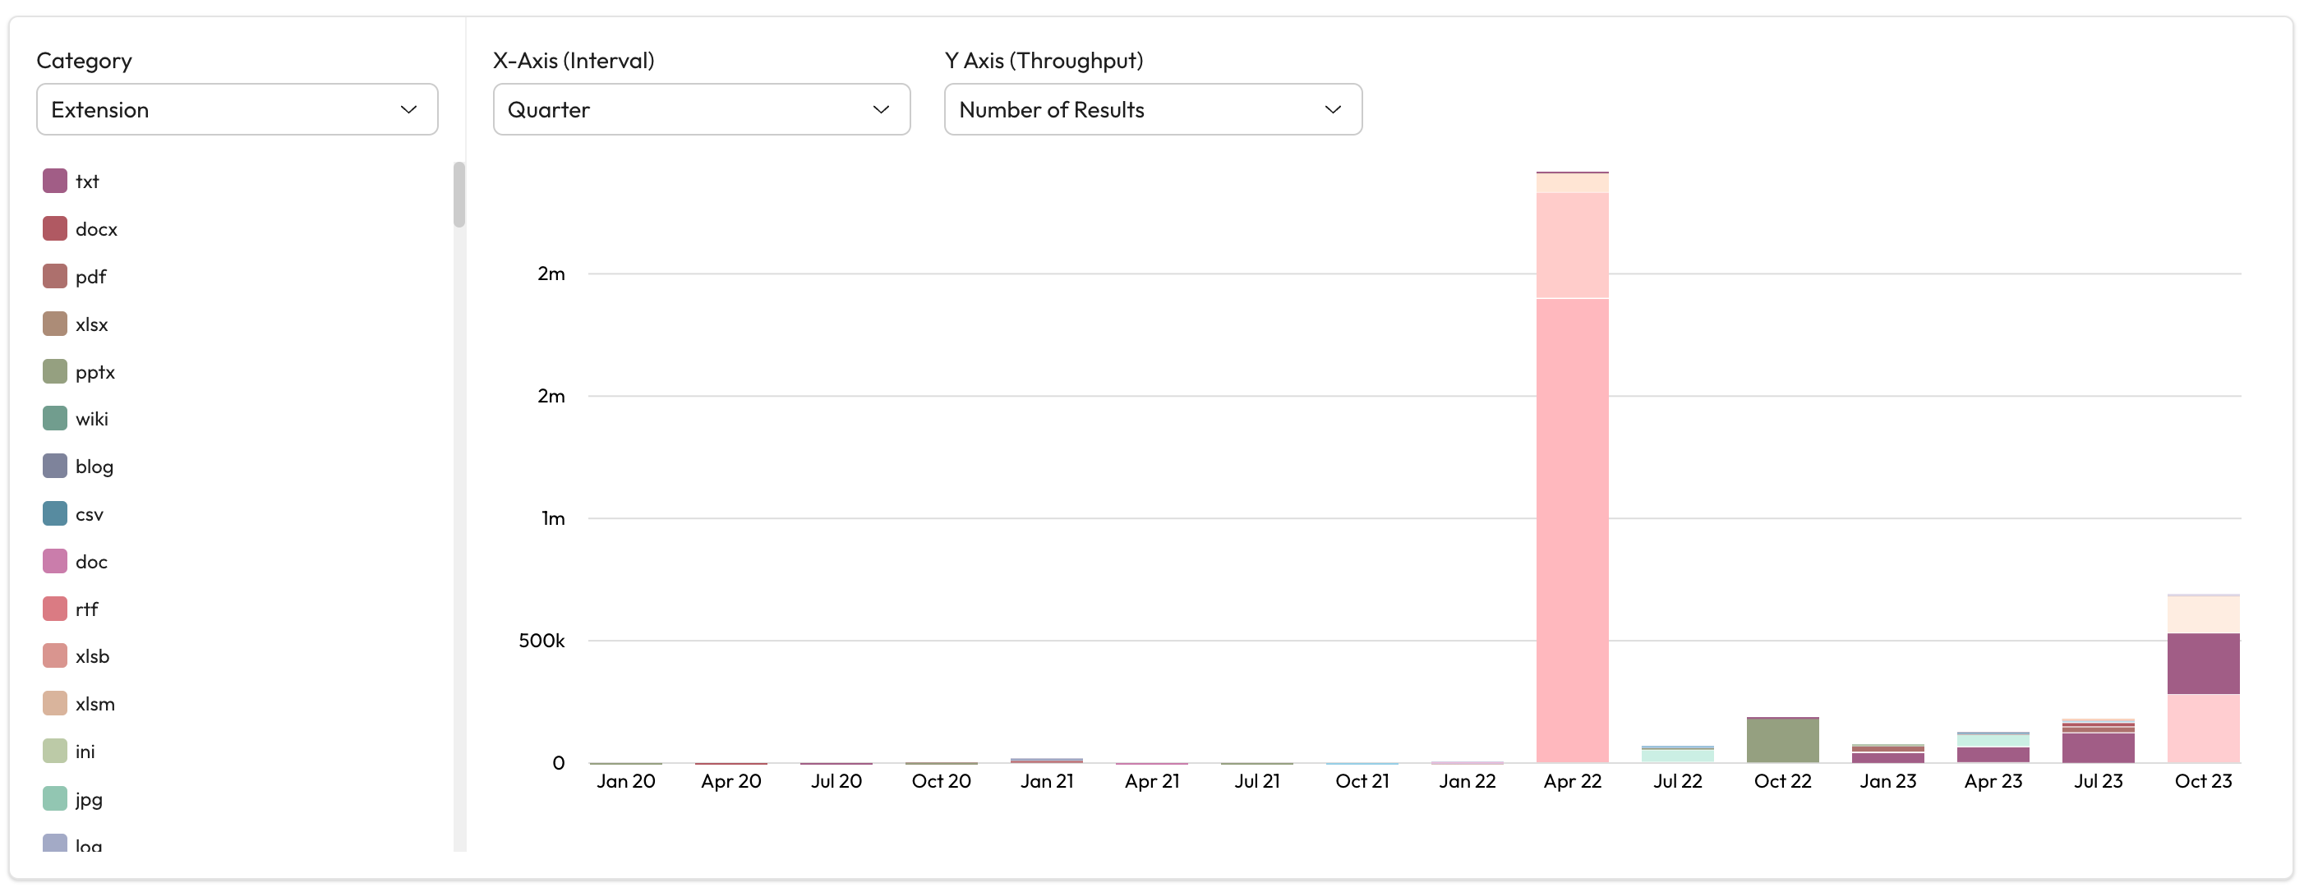
Graph Axis
Category - Choose how your data is grouped.
Status - Group scanned or enriched items their status.
Extension - Group scanned or enriched items by their file extension.
Source - Group scanned or enriched items by their source system.
X-Axis (Interval) - Choose the timescale you want to see.
You can see how things have changed over time or see exactly when an issue started.
Y-Axis (Throughput) - Choose the value used to plot the data on your graph.
Number of Results - The total number of items in each category.
Size of Files - The total size (MB) of all items in each category.
Use Case Examples
Compare the size of files in a source over a number of months.
This could help identify sources that aren't used, use the most storage or may take the longest to crawl. Category - Source X-Axis (Interval) - Months Y-Axis (Throughput) - Size of Files
Compare the types of files that are being created over time.
This could help identify software that is no longer needed, need updating, or are just the most popular. Category - Extension X-Axis (Interval) - Any time period you want to see
Y-Axis (Throughput) - Number of Results
See what exception statuses each source has to identify sources that need investigating.
Filter - Select a source to investigate. Category - Status X-Axis (Interval) - Any time period you want to see Y-Axis (Throughput) - Number of Results
Filtering Your Graph
You can apply filters from the filters panel to change the bar graph and breakdown table. This can be help if you want to investigate a specific source, file type or users items.
For example, selecting a source in the filters panel will update the graph to show the data for that source only.
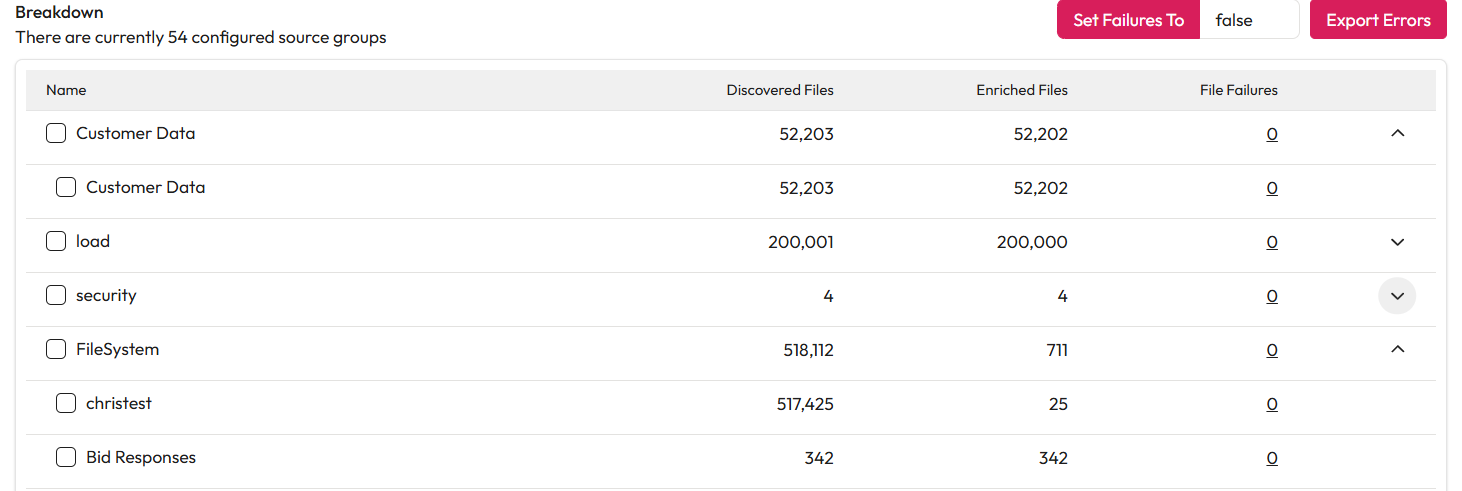
Breakdown Table
The breakdown table shows the headline stats broken down by source and sub source. You can see the discovered, enriched and failed files in more detail.
Exporting Errors
If you have any file failure you can export them as a CSV file. Select Export Errors to export all errors or check the specific sources and select Export Errors. You can then review these in more detail and decide how you want to proceed with them.